OOD Detection for EEG-based Machine Learning in High-Risk Environments
The authors benchmark out-of-distribution detection methods for EEG models across two clinical prediction tasks to evaluate their downstream efficacy alongside uncertainty estimation.
1. Introduction: The Hidden Risks of Silent AI Failures in EEG Analysis
Machine learning (ML) models trained on electroencephalography (EEG) data present significant promise for automating clinical diagnostics, such as identifying brain pathology or classifying cognitive impairment. However, deploying these models in high-risk healthcare environments exposes critical vulnerabilities. EEG signals are extraordinarily sensitive to real-world distribution shifts. Minor hardware variations across clinics, subtle mismatches in preprocessing pipelines (such as filtering cutoff frequencies or reference electrode montages), and demographic shifts in patient populations can significantly alter signal characteristics. When deep neural networks encounter such out-of-distribution (OOD) data, they frequently suffer from catastrophic prediction failures while paradoxically outputting high confidence scores. In a clinical setting, these silent failures risk delivering invalid medical assessments without warning practitioners.
To address these vulnerabilities, a benchmark study by Philipp Bomatter and Henry Gouk (2026) systematically evaluates out-of-distribution detection methods for EEG models and tests their practical efficacy on downstream clinical prediction tasks. Rather than evaluating OOD detection strictly in artificial isolation—such as measuring a model’s ability to distinguish entirely different datasets or disjoint semantic classes—the authors assess OOD detection directly through its operational impact on downstream clinical diagnostic accuracy.
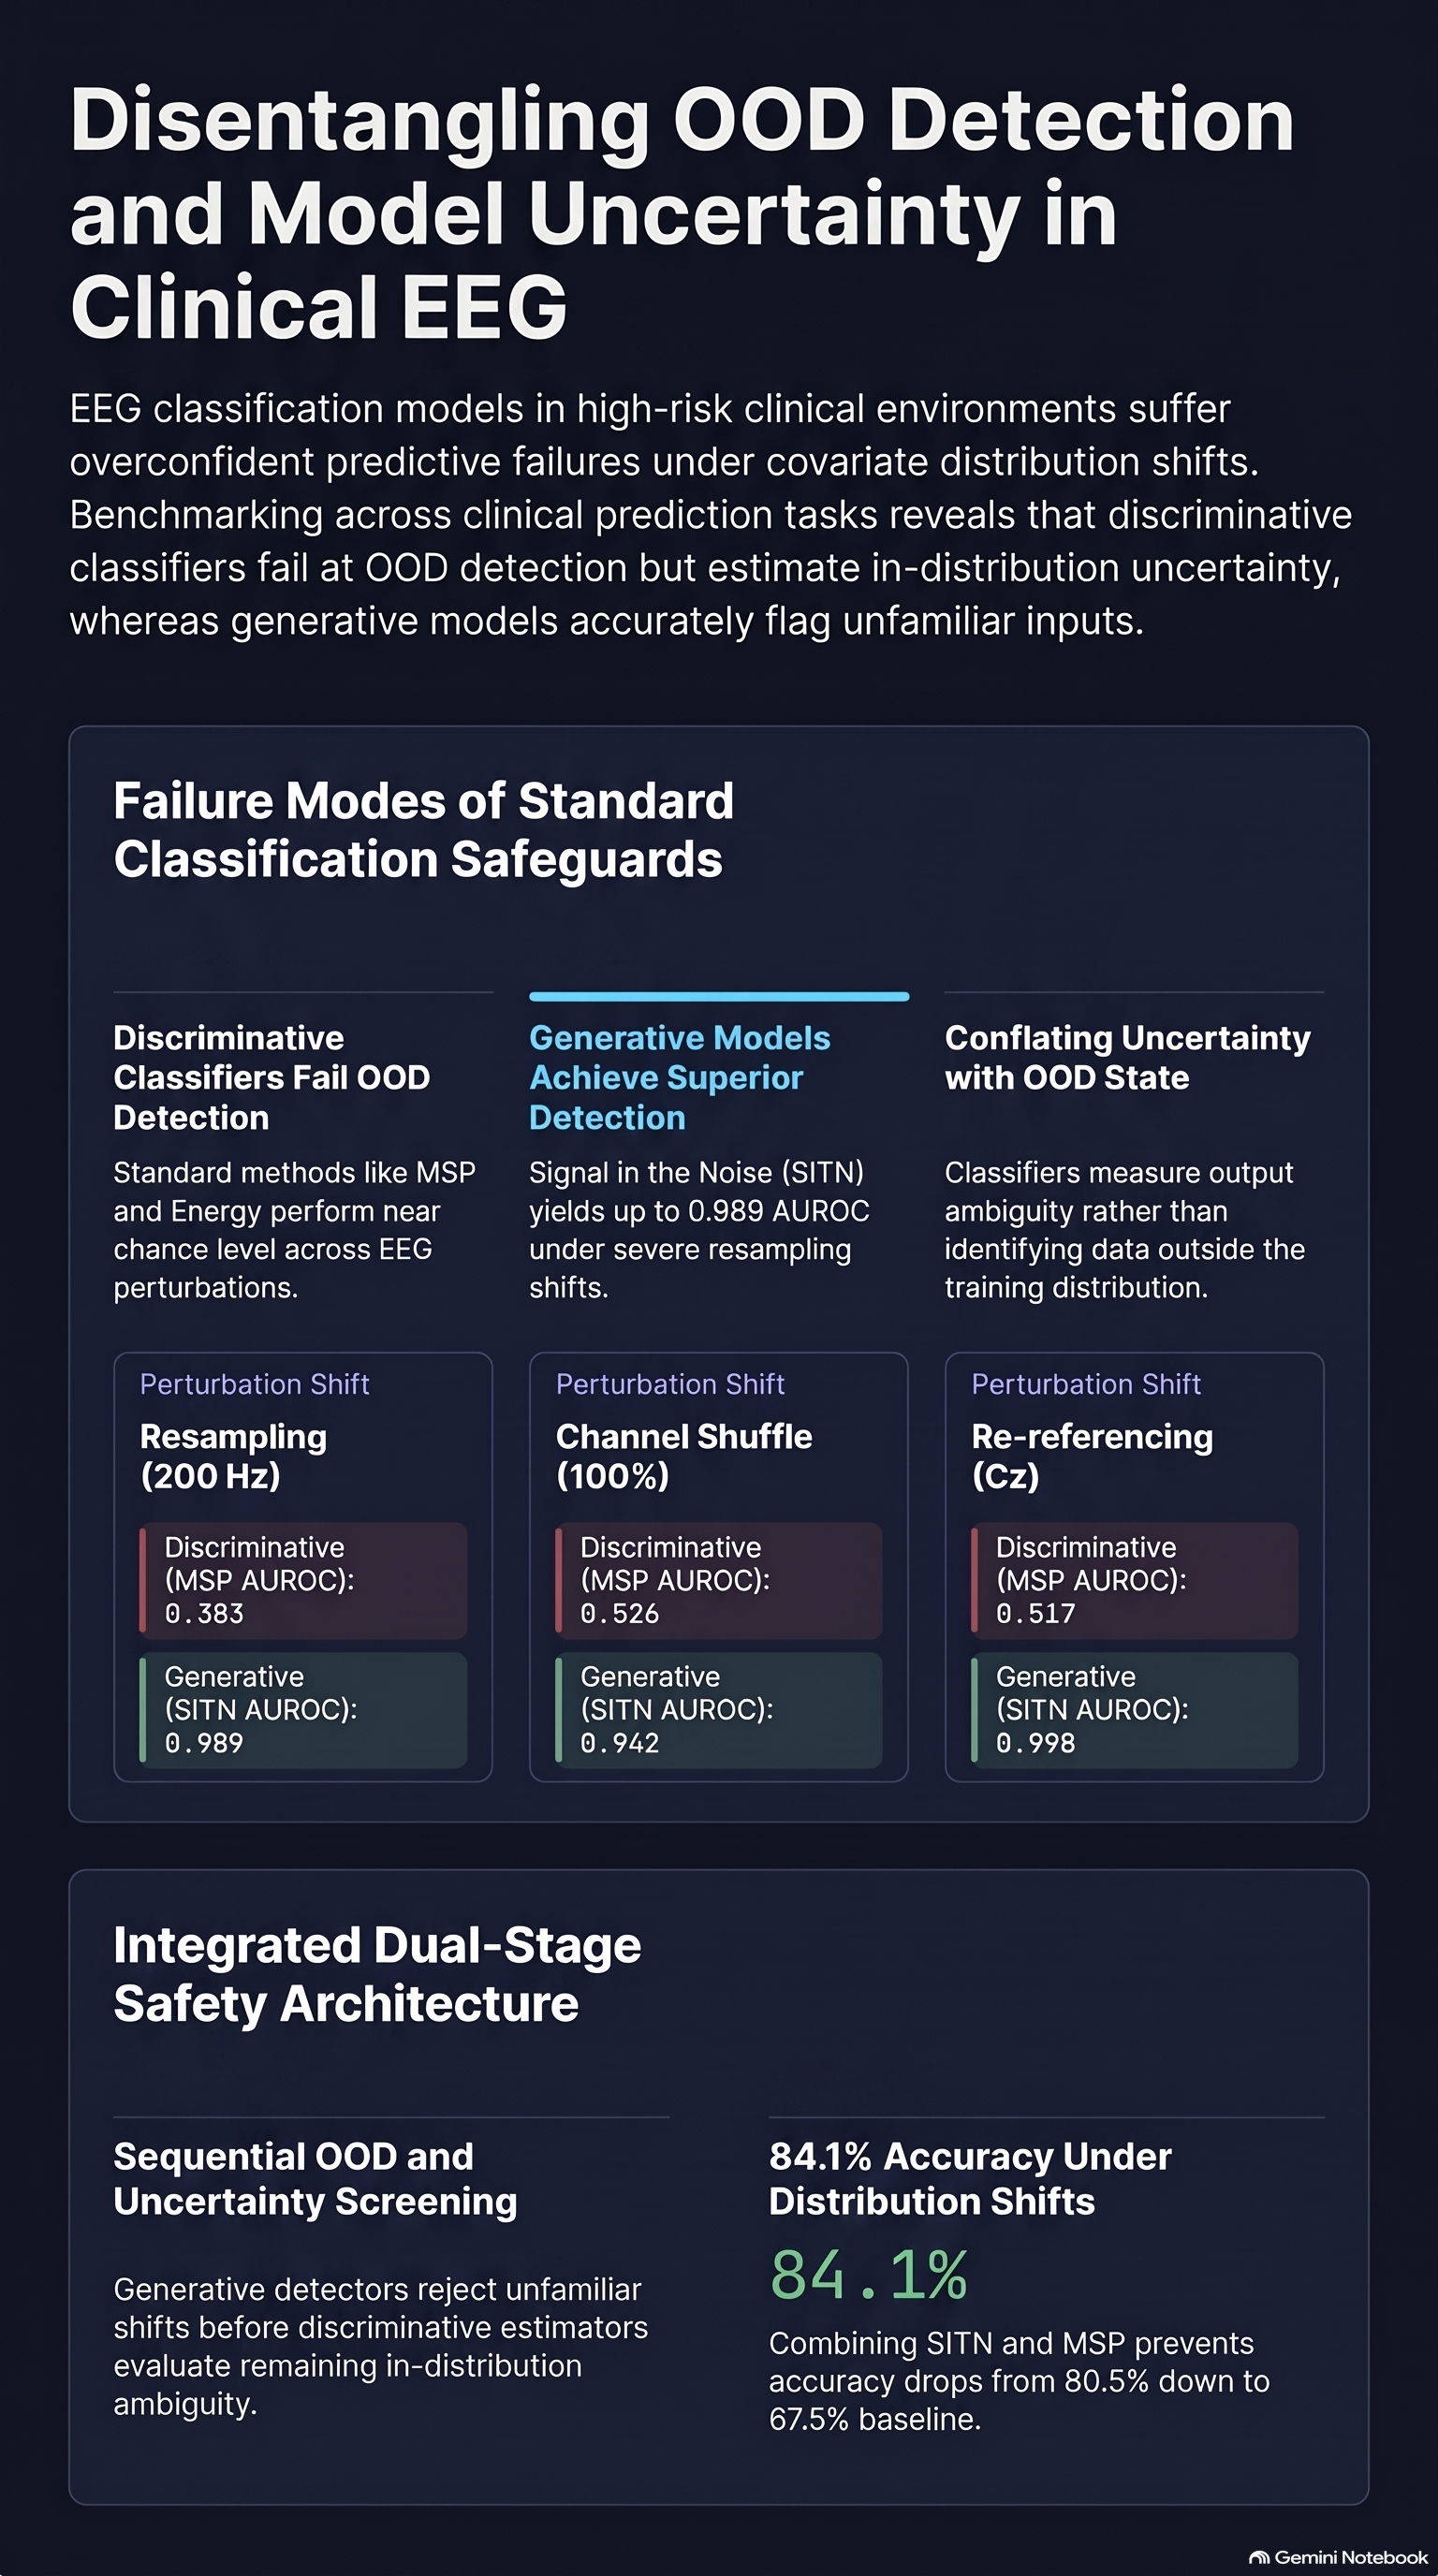
The central thesis of the study demonstrates that standard discriminative OOD detectors fail to identify OOD EEG signals caused by realistic covariate shifts, operating near chance level (). Conversely, generative models—specifically methods evaluating latent space representations such as Signal in the Noise (SITN)—successfully detect severe distribution shifts. Furthermore, the paper demonstrates that generative OOD detection and discriminative model uncertainty estimation capture fundamentally distinct failure modes. By integrating generative OOD detection with discriminative uncertainty estimation into a joint decision pipeline, practitioners can establish a robust safety net against silent predictive failures in safety-critical EEG applications.
2. Deconstructing the Benchmark: Controlled EEG Perturbations & Architecture Setup
To evaluate EEG model robustness under realistic clinical conditions, Bomatter and Gouk established a controlled benchmarking framework using two major clinical EEG datasets:
- TUAB (Temple University Hospital Abnormal EEG Corpus): A curated dataset of over 2,300 participants annotated by board-certified neurologists for EEG normality versus pathology, evaluated as a binary classification task.
- CAUEEG (Chung-Ang University Hospital EEG): A dataset of 1,122 participants featuring diagnostic annotations for normal cognition, mild cognitive impairment (MCI), or dementia, evaluated as a three-way classification task.
The study implemented a dual-model architecture trained exclusively on the unperturbed in-distribution (ID) training split of each dataset:
- Generative Model: An unsupervised UNet architecture (following Ho et al. and Dhariwal & Nichol) trained via a continuous-time flow-matching objective. Continuous-time flow matching constructs a linear path for between Gaussian noise and data , optimizing a neural network to learn the vector field mapping noise to the underlying probability distribution of unlabelled EEG signals. During evaluation, backward integration along the probability flow Ordinary Differential Equation (ODE) is executed using an ODE solver (Euler’s method with 100 timesteps).
- Discriminative Model: A supervised Temporal Convolutional Network (TCN) featuring 4 residual blocks, 64 filters per layer, and kernel size of 5 with dilated convolutions (), trained via cross-entropy loss to execute the specific downstream clinical classification task.
To evaluate model behavior under precise distribution shifts, the authors introduced a suite of five parametrizable EEG perturbations. Applying these transformations directly to the unperturbed ID test set created perfectly paired OOD test samples, providing the precise methodological isolation required to measure downstream clinical accuracy drops directly attributable to covariate shift.
| Perturbation Type | Description & Parameter Variations |
|---|---|
| Sampling Rate Shift | Signals are resampled to higher rates (, , ) via bandlimited sinc interpolation relative to the baseline training rate of , causing signals to appear artificially smoothed to models expecting lower sampling frequencies. |
| Channel Order Permutation | The positional layout of a random subset of channels in the 19-channel 10–20 system is permuted (swapping 10%, 50%, or 100% of channels), simulating physical electrode plugging errors into recording amplifiers. |
| Reference Scheme Changes | Average-referenced training data is re-referenced to alternative clinical montages: Cz monopolar reference, linked-temporal reference (average of T7 and T8), or a longitudinal double-banana bipolar montage. |
| High-pass Filtering | Additional zero-phase Butterworth high-pass filtering is applied with increasing cutoff frequencies (, , ) relative to the baseline, progressively stripping low-frequency neural activity. |
| Low-pass Filtering | Additional low-pass filtering is applied with decreasing cutoff frequencies (, , ) relative to the baseline, progressively eliminating high-frequency neural activity. |
3. Empirical Benchmark Results: Generative vs. Discriminative Paradigms
The benchmark evaluated OOD detection performance using the Area Under the Receiver Operating Characteristic () curve across all perturbations and severity levels. The empirical findings reveal a dramatic divergence between discriminative and generative paradigms across both datasets.
Discriminative Failure Modes
Methods operating directly on the output logits or Softmax distributions of the supervised TCN—including Maximum Softmax Probability (MSP), Energy score, Out-of-Distribution Detector for Neural Networks (ODIN), and Activation Shaping (ASH)—proved largely incapable of detecting covariate distribution shifts. Across the majority of perturbation conditions on TUAB, discriminative methods performed near chance level (). Under sampling rate shifts on TUAB, MSP achieved scores of 0.517 at , 0.457 at , and 0.383 at . Under a 100% channel shuffle on TUAB, MSP scored 0.526, ODIN scored 0.529, and ASH scored 0.460.
Penultimate Embedding Densities: The Mahalanobis Distance Middle Ground
To probe whether discriminative models possess OOD awareness prior to the final classification layer, the benchmark evaluated the Mahalanobis distance metric (Appendix B). This approach extracts penultimate-layer feature activations immediately following the TCN’s global average pooling layer, modeling class-conditional Gaussian distributions with a shared precision matrix fitted on ID validation data.
Mahalanobis distance represents a structural middle ground, yielding improved OOD detection under physical and spatial shifts. On TUAB, it achieved scores of 0.654 under resampling, 0.775 under 100% channel shuffle, and 0.851 under Cz re-referencing (reaching 0.925 on CAUEEG). However, Mahalanobis distance exhibited a catastrophic vulnerability under high-pass filtering: its performance collapsed to an of 0.285 at on TUAB and 0.153 on CAUEEG. Under frequency-attenuating shifts, feature embeddings systematically drift toward class centroids, causing Mahalanobis distance to perform substantially worse than random guessing.
Generative Superiority & Latent Space Goodness-of-Fit
In contrast, generative-model-based detection approaches—specifically Typicality, Density of State Estimation (DoSE), and Signal in the Noise (SITN)—achieved vastly superior OOD detection performance. Crucially, their detection capability scaled monotonically with perturbation severity.
Generative methods leverage explicit density modeling or latent space geometry. SITN operates by integrating continuous-time flow-matching ODE trajectories backward from data space to latent space using Euler integration over 100 timesteps. Rather than relying on scalar likelihoods, SITN performs a factorized goodness-of-fit test assessing whether the backward-integrated latent vector conforms to the isotropic standard Gaussian prior .
On the TUAB dataset, SITN consistently emerged as the top-performing detector:
- Re-referencing (Cz Monopolar): SITN achieved an of 0.998 (vs. MSP’s 0.517).
- Sampling Rate Shift (): SITN achieved an of 0.989 (vs. MSP’s 0.383).
- Low-pass Filtering (): SITN achieved an of 0.990 (vs. MSP’s 0.511).
- Channel Shuffle (100%): SITN achieved an of 0.942 (vs. MSP’s 0.526).
Comparative evaluations on the CAUEEG benchmark (Appendix A) corroborated these dynamics while introducing subtle paradigm shifts. On CAUEEG, DoSE (specifically , which fits kernel density estimators over likelihood, latent prior probability, and Jacobian determinant statistics) narrowly surpassed SITN under specific montages:
- Re-referencing (Cz, T7/T8, Bipolar): DoSE achieved a perfect of 1.000 across all three montages on CAUEEG, slightly outperforming SITN (0.997).
- Low-pass Filtering (): DoSE achieved an of 0.998 on CAUEEG, compared to SITN’s 0.994.
- Sampling Rate Shift (): SITN retained leadership on CAUEEG with an of 0.992 (vs. DoSE’s 0.965 and MSP’s 0.470).
- High-pass Filtering (): SITN achieved an of 0.899 on CAUEEG (vs. DoSE’s 0.626 and MSP’s 0.518).
The Likelihood Paradox in High-Dimensional EEG Space
The benchmark highlights a critical failure mode regarding raw generative Log-likelihood. On the TUAB resampling shift, raw log-likelihood produced an of 0.143 (and 0.056 on CAUEEG), meaning OOD samples were assigned systematically higher probability densities than valid in-distribution data.
This empirical result confirms that EEG analysis suffers from the high-dimensional likelihood paradox previously identified in computer vision (e.g., Serrà et al.). Raw log-likelihood measures signal complexity rather than domain validity. Artificially smoothed EEG signals (such as those resampled to or flat channels) occupy high-density probability volume, yielding inflated log-likelihoods. Conversely, high-amplitude physiological or electrode artifacts yield extremely low log-likelihoods regardless of whether they originate from in-distribution recordings. Specialized metrics like SITN and DoSE bypass this paradox by evaluating factorized latent prior structure and probability mass distributions rather than unnormalized volume densities.
4. Conceptual Breakthrough: Disentangling True OOD Detection from Model Uncertainty
By evaluating downstream classification accuracy across percentile bins of OOD detector scores, Bomatter and Gouk resolved a persistent ambiguity in machine learning safety research: the conflation of true OOD detection with model uncertainty estimation.
                    ┌─────────────────────────────────────────┐
                    │            Input EEG Signal             │
                    └────────────────────┬────────────────────┘
                                         │
                                         ▼
                    ┌─────────────────────────────────────────┐
                    │     Stage 1: Generative OOD Filter      │
                    │                 (SITN)                  │
                    └─────────┬─────────────────────┬─────────┘
                              │                     │
                  Fails Check │                     │ Passes Check
             (Unfamiliar Data)│                     │ (Familiar Data)
                              ▼                     ▼
                   ┌────────────────────┐ ┌───────────────────┐
                   │ Abstain / Defer to │ │ Stage 2: ID Model │
                   │    Human Expert    │ │ Uncertainty (MSP) │
                   └────────────────────┘ └─┬───────────────┬─┘
                                            │               │
                             High Uncertainty│               │ Low Uncertainty
                             (Ambiguous ID) │               │ (Confident ID)
                                            ▼               ▼
                                 ┌──────────────────┐ ┌───────────┐
                                 │ Abstain / Defer  │ │ Predict   │
                                 │ to Human Expert  │ │ Output    │
                                 └──────────────────┘ └───────────┘
True OOD Detection (Generative Paradigm)
Generative methods like SITN evaluate data familiarity. They measure whether an input sample resides within the support of the training data distribution. When presented with severe covariate shifts (such as resampling), SITN isolates OOD samples into extreme score percentiles. Downstream evaluations confirm that discriminative TCN accuracy on these flagged OOD samples drops to chance level ( on TUAB binary classification, on CAUEEG three-way classification). True OOD detection serves as an external safety filter, identifying inputs where the classifier lacks valid exposure.
Model Uncertainty Estimation & The Overconfidence Anomaly
Discriminative methods like MSP evaluate predictive ambiguity. Although MSP fails to separate covariate-shifted data from ID data, it exhibits strong predictive calibration across unperturbed in-distribution samples. Within familiar ID data, lower MSP scores correlate with reduced accuracy on difficult, boundary-adjacent patient cases.
However, the benchmark uncovered a severe diagnostic failure mode within discriminative metrics: the Overconfidence Anomaly. When evaluating MSP across score percentiles on combined ID and OOD data (TUAB resampling), classification accuracy increases monotonically alongside confidence up to the 99.9th percentile (reaching accuracy). But at the extreme 99.9–100th percentile bin—where the model asserts maximum certainty—accuracy plummets catastrophically to (worse than chance level).
Even when restricted strictly to in-distribution ID data, MSP accuracy drops from at the 99.9th percentile down to in the top 0.1% confidence bin. This anomaly occurs because discriminative neural networks assign maximum Softmax confidence to specific corrupted, highly filtered, or artifact-laden signals that project far along extreme decision-boundary trajectories. Discriminative models fail most catastrophically precisely when asserting maximum confidence. In contrast, SITN exhibits monotonic reliability, maintaining uniform high accuracy across accepted score percentiles without overconfidence collapses.
These findings validate the theoretical framework of Li et al. (2025): standard supervised discriminative classifiers “answer the wrong question for OOD detection.” Repurposing classification confidence as an OOD metric is fundamentally flawed for detecting covariate distribution shifts, yet discriminative confidence remains valuable as an internal proxy for model uncertainty on familiar data.
5. The Dual Safety Net: Combining OOD Detection and Uncertainty Estimation
Because generative OOD detection and discriminative model uncertainty capture complementary failure modes, Bomatter and Gouk proposed a dual-stage rejection architecture for clinical deployment.
Under this framework, incoming EEG recordings pass through a two-stage sequential evaluation. First, a generative OOD detector (SITN, calibrated on ID validation data to enforce a fixed false positive rate) screens for data familiarity. Samples passing the OOD check proceed to a discriminative uncertainty estimator (MSP, calibrated via isotonic regression on ID validation data). If the calibrated probability of correct classification falls below a defined clinical threshold (e.g., ), the system abstains. The clinical model outputs an automated prediction only if an input satisfies both safety checks; otherwise, it defers to a human neurologist.
The operational performance of this dual safety net is detailed in Table 2 for the TUAB dataset under a severe resampling shift (evaluated on an experimental test pool comprising an equal 50/50 mix of unperturbed ID samples and perturbed OOD samples).
| Rejection System State | ID Only Coverage | ID Only Accuracy | Combined (ID + OOD) Coverage | Combined (ID + OOD) Accuracy |
|---|---|---|---|---|
| Baseline (No Rejection) | 100.0% | 80.5% | 100.0% | 67.5% |
| SITN Only (OOD Detection) | 98.5% | 80.8% | 49.5% | 80.7% |
| MSP Only (Model Uncertainty) | 88.1% | 83.8% | 89.2% | 69.3% |
| Combined (SITN + MSP) | 86.9% | 84.1% | 43.7% | 84.1% |
Granular Coverage & Operational Breakdown
Understanding the coverage metrics requires tracing sample movement through the dual pipeline across the 50/50 ID+OOD test pool:
- Unprotected Baseline: Without rejection, encountering the resampling shift causes overall diagnostic accuracy to collapse from (ID only) down to across the combined pool.
- MSP Single Safety Net: Applying MSP rejection alone filters out ambiguous samples, improving ID-only accuracy to (at ID coverage). However, because MSP cannot recognize covariate shifts, it fails to reject resampled OOD inputs. The accepted pool remains heavily contaminated with OOD samples, yielding a poor combined accuracy of despite rejecting over of total inputs.
- SITN Single Safety Net: SITN correctly evaluates data familiarity. Across the 50/50 pool, SITN flags and rejects of all samples—successfully rejecting of OOD samples while maintaining a tight false positive rate on ID data ( ID coverage). This isolates an accepted pool of total coverage (consisting almost exclusively of valid ID signals), stabilizing combined accuracy at .
- Combined Dual Safety Net: The hybrid pipeline achieves superior performance. SITN first eliminates the unfamiliar OOD sample population, reducing the pool to coverage. MSP then probes this remaining valid ID population, rejecting an additional of total samples that exhibit high internal decision ambiguity. This yields a final accepted coverage of with an overall clinical diagnostic accuracy of .
6. Conclusion & Key Takeaways for AI Safety Researchers
The benchmarking study by Bomatter and Gouk demonstrates that evaluating out-of-distribution detection methods in isolation—without measuring downstream task performance—obscures clinical utility. By measuring OOD detection directly alongside downstream diagnostic accuracy, the authors clarify how distribution shifts trigger silent model failures and demonstrate how layered architectures mitigate these risks.
Key takeaways for machine learning reliability and clinical AI safety include:
- Generative Primacy for True OOD Detection: Generative models—specifically latent space goodness-of-fit methods like SITN and multi-statistic estimators like DoSE—represent the current state-of-the-art for detecting covariate distribution shifts in EEG signals, vastly outperforming discriminative methods.
- Functional Separation of Safety Signals: AI safety architectures must explicitly decouple OOD detection (which evaluates data familiarity relative to the training manifold) from model uncertainty estimation (which quantifies decision ambiguity on familiar data).
- Layered Defense Implementation: High-risk clinical deployments require hybrid rejection pipelines. Sequential pipelines combining generative OOD filters with calibrated discriminative uncertainty thresholds maximize classification accuracy and eliminate overconfident mispredictions.
- Benchmark Reform in ML Safety: Benchmarking protocols must move beyond evaluating purely semantic class shifts in isolation. Future ML safety evaluations must prioritize realistic covariate distribution shifts evaluated directly against downstream task performance.
Read the full paper on arXiv · PDF